How was TSS identified?
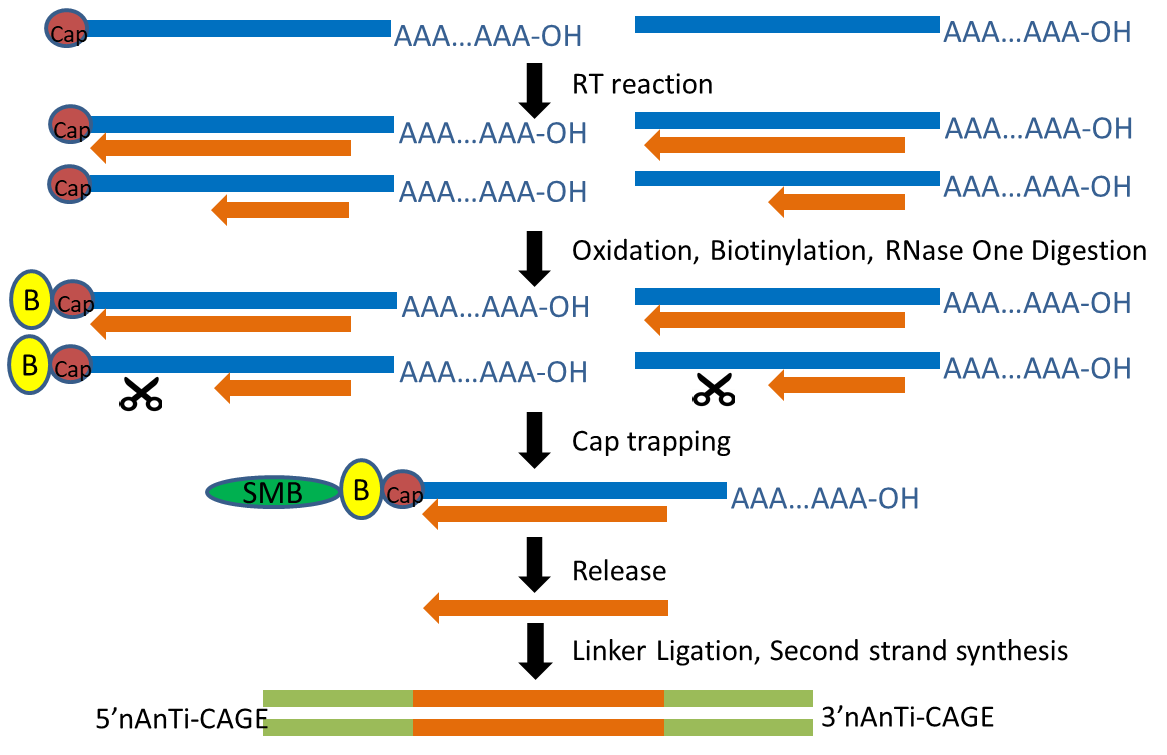
The transcription start site of each transcript was obtained by Cap Analysis of Gene Expression (CAGE), a method for promoter identification and transcription profiling developed by RIKEN (Shiraki, Kondo et al. 2003, Kodzius, Kojima et al. 2006). CAGE utilizes a “cap-trapping” technology based on the biotinylation of the 7-methylguanosine cap of Pol II transcripts, to pull down the 5’-complete cDNAs reversely transcribed from the captured transcripts. Through a massive parallel sequencing of the 5’ end of cDNA and analysis of the sequenced tags, transcription start sites and transcripts amount are inferred on a genome-wide scale.
What are the advantages of CAGE techniques?
Various techniques have been used to identify TSS at a genome scale for yeast, such as microarray (Hurowitz and Brown 2003, David, Huber et al. 2006, Xu, Wei et al. 2009), SAGE (serial analysis of gene expression) (Zhang and Dietrich 2005), sequencing of full-length cDNA clones (Miura, Kawaguchi et al. 2006) and RNA-seq (Nagalakshmi, Wang et al. 2008). The microarray method could not provide a single-nucleotide resolution of TSS due to the limitation of probe design. RNA-seq is known to have a shortcoming of inaccurate determination of transcription starts (Batut, Dobin et al. 2013, Steijger, Abril et al. 2013, Boley, Stoiber et al. 2014), as assembly of RNA-seq reads usually extends transcript contigs to the last base (Wang, Guo et al. 2010, Grabherr, Haas et al. 2011), which often lack information of other TSSs and their usage. Sequencing of full-length cDNA clones, which interrogate of 5’-ends of RNAs, can provide more accurate identification of TSS (Miura, Kawaguchi et al. 2006). However, it lacks the throughput to provide sufficient data for lowly expressed genes and the quantitative measurements of TSS usage (Shiraki, Kondo et al. 2003). Transcript isoform sequencing (TIF-seq) (Pelechano, Wei et al. 2014) also captures the 7-methyl guanosine cap structure at the 5’end of transcripts, and sequence the transcripts using high-throughput sequencers, such as Illumina. TIF-seq is the bias toward short RNA molecules, which is a common issue of full-length cDNA sequencing approach (Miura, Kawaguchi et al. 2006). TIF-seq also requires PCR amplification and restriction enzyme digestion.
The TSS maps we generated was based on a new CAGE protocol “nAnT-iCAGE” (Murata, Nishiyori-Sueki et al. 2014), which is little-biased because it does not involve PCR amplification, restriction enzyme digestion, or hybridization (Murata, Nishiyori-Sueki et al. 2014).
How was core promoter predicted?
TSSs in a small genomic region reflect the transcriptional activity of that core promoter. TSSs highly enriched within 20bp of each other were clustered as tag clusters (TCs). TCs were then aggregated together if their boundaries (positions of 10% quantiles and positions of 90% quantiles) are less than 50bp apart into a single set non-overlapping consensus clusters, corresponding putatively core promoters.
How many species are included in this database?
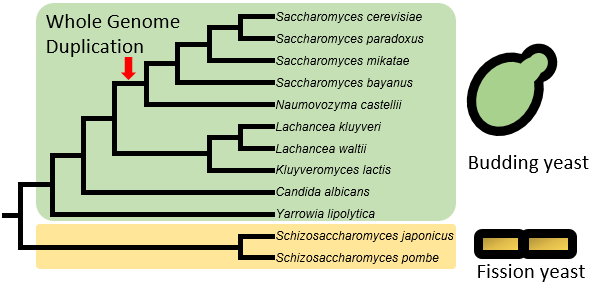
Currently, the “Yeast TSS Atlas” includes quantitative TSS maps and predicted core promoters from 12 yeast species, including 10 budding yeast species (such as model organism Saccharomyces cerevisiae and human pathogen Candida albicans) and two fission yeast species (including another model organism Schizosaccharomyces pombe). Data from more species will be added upon completion. For S. cerevisiae, we used strain of BY4741 (MATa his3Δ1 leu2Δ0 met15Δ0 ura3Δ0), a haploid derivative of laboratory strain S288c.
What growth conditions were used to generate these TSS maps?
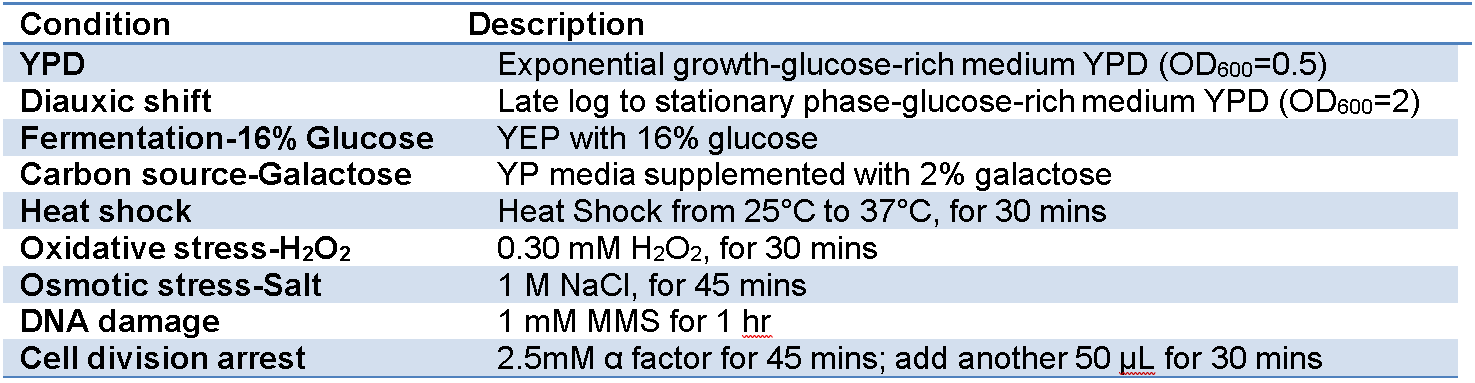
All species were grown to mid-log phase in YPD medium at 30°C for total RNA isolation. In addition to YPD, S. cerevisiae were also grown in other eight growth conditions that simulate their natural environments (Table 1).
What are the applications of quantitative TSS maps?
The locations and activities of TSS are valuable for precisely determining the 5’boundary and the 5’untranslated region (5’UTR) of protein coding genes, improving genome annotation, and predictions of novel genes, core promoter elements, transcription factor (TF) binding sites, and other motifs associated with transcription and inferring gene regulatory network.
How to use JBrowse to visualize YeasTSS data
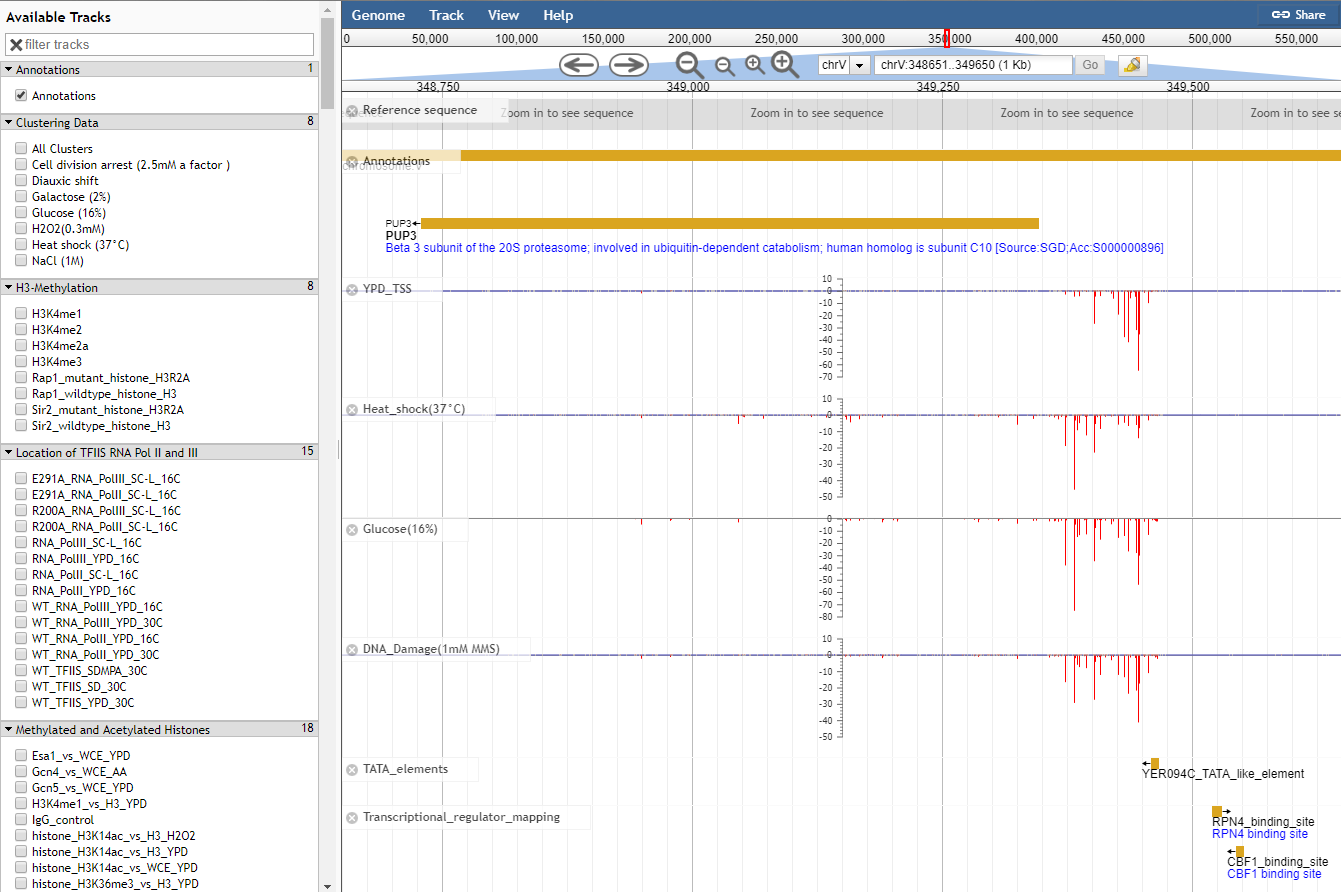
Navigating to the JBrowse genome browser on the YeasTSS will bring users to a page where TSS and core promoter can be viewed alongside Gencode gene annotations. This tutorial will walk you through how to make sense of the tracks on the genome browser and also provide some tips to customize JBrowse.
Moving
Move the view by clicking and dragging in the track area, or by clicking or in the navigation bar, or by pressing the left and right arrow keys.
Center the view at a point by clicking on either the track scale bar or overview bar, or by shift-clicking in the track area.
Zooming
Zoom in and out by clicking or in the navigation bar, or by pressing the up and down arrow keys while holding down "shift". Select a region and zoom to it ("rubber-band" zoom) by clicking and dragging in the overview or track scale bar, or shift-clicking and dragging in the track area.
Showing Tracks
Turn a track on by dragging its track label from the "Available Tracks" area into the genome area, or double-clicking it. Turn a track off by dragging its track label from the genome area back into the "Available Tracks" area.
Searching
Jump to a feature or reference sequence by typing its name in the location box and pressing Enter. Jump to a specific region by typing the region into the location box as: ref:start..end.
Example Searches
PUP3
Searches for the feature named PUP3.
chr4
Jumps to chromosome 4
chr4:40,000..60,000
Jumps the region on chromosome 4 between 40,000 and 60,000
45678
centers the display at base 45,678 on the current sequence
Cite YeasTSS
If you use YeasTSS, please cite:
McMillan J, Lu Z, Rodriguez JS, Ahn TH, Lin Z. 2019. YeasTSS: an integrative web database of yeast transcription start sites. Database (Oxford) 2019.
References
Batut, P., A. Dobin, C. Plessy, P. Carninci and T. R. Gingeras (2013). "High-fidelity promoter profiling reveals widespread alternative promoter usage and transposon-driven developmental gene expression." Genome Res 23(1): 169-180.
Boley, N., M. H. Stoiber, B. W. Booth, K. H. Wan, R. A. Hoskins, P. J. Bickel, S. E. Celniker and J. B. Brown (2014). "Genome-guided transcript assembly by integrative analysis of RNA sequence data." Nat Biotechnol 32(4): 341-346.
David, L., W. Huber, M. Granovskaia, J. Toedling, C. J. Palm, L. Bofkin, T. Jones, R. W. Davis and L. M. Steinmetz (2006). "A high-resolution map of transcription in the yeast genome." Proc Natl Acad Sci U S A 103(14): 5320-5325.
Grabherr, M. G., B. J. Haas, M. Yassour, J. Z. Levin, D. A. Thompson, I. Amit, X. Adiconis, L. Fan, R. Raychowdhury, Q. Zeng, Z. Chen, E. Mauceli, N. Hacohen, A. Gnirke, N. Rhind, F. di Palma, B. W. Birren, C. Nusbaum, K. Lindblad-Toh, N. Friedman and A. Regev (2011). "Full-length transcriptome assembly from RNA-Seq data without a reference genome." Nat Biotechnol 29(7): 644-652.
Hurowitz, E. H. and P. O. Brown (2003). "Genome-wide analysis of mRNA lengths in Saccharomyces cerevisiae." Genome Biol 5(1): R2.
Kodzius, R., M. Kojima, H. Nishiyori, M. Nakamura, S. Fukuda, M. Tagami, D. Sasaki, K. Imamura, C. Kai, M. Harbers, Y. Hayashizaki and P. Carninci (2006). "CAGE: cap analysis of gene expression." Nat Methods 3(3): 211-222.
Miura, F., N. Kawaguchi, J. Sese, A. Toyoda, M. Hattori, S. Morishita and T. Ito (2006). "A large-scale full-length cDNA analysis to explore the budding yeast transcriptome." Proc Natl Acad Sci U S A 103(47): 17846-17851.
Murata, M., H. Nishiyori-Sueki, M. Kojima-Ishiyama, P. Carninci, Y. Hayashizaki and M. Itoh (2014). "Detecting expressed genes using CAGE." Methods Mol Biol 1164: 67-85.
Nagalakshmi, U., Z. Wang, K. Waern, C. Shou, D. Raha, M. Gerstein and M. Snyder (2008). "The transcriptional landscape of the yeast genome defined by RNA sequencing." Science 320(5881): 1344-1349.
Pelechano, V., W. Wei, P. Jakob and L. M. Steinmetz (2014). "Genome-wide identification of transcript start and end sites by transcript isoform sequencing." Nat Protoc 9(7): 1740-1759.
Shiraki, T., S. Kondo, S. Katayama, K. Waki, T. Kasukawa, H. Kawaji, R. Kodzius, A. Watahiki, M. Nakamura, T. Arakawa, S. Fukuda, D. Sasaki, A. Podhajska, M. Harbers, J. Kawai, P. Carninci and Y. Hayashizaki (2003). "Cap analysis gene expression for high-throughput analysis of transcriptional starting point and identification of promoter usage." Proc Natl Acad Sci U S A 100(26): 15776-15781.
Steijger, T., J. F. Abril, P. G. Engstrom, F. Kokocinski, T. J. Hubbard, R. Guigo, J. Harrow, P. Bertone and R. Consortium (2013). "Assessment of transcript reconstruction methods for RNA-seq." Nat Methods 10(12): 1177-1184.
Wang, B., G. Guo, C. Wang, Y. Lin, X. Wang, M. Zhao, Y. Guo, M. He, Y. Zhang and L. Pan (2010). "Survey of the transcriptome of Aspergillus oryzae via massively parallel mRNA sequencing." Nucleic Acids Res 38(15): 5075-5087.
Xu, Z., W. Wei, J. Gagneur, F. Perocchi, S. Clauder-Munster, J. Camblong, E. Guffanti, F. Stutz, W. Huber and L. M. Steinmetz (2009). "Bidirectional promoters generate pervasive transcription in yeast." Nature 457(7232): 1033-1037.
Zhang, Z. and F. S. Dietrich (2005). "Mapping of transcription start sites in Saccharomyces cerevisiae using 5' SAGE." Nucleic Acids Res 33(9): 2838-2851.